|
Joint Economic Committee Democrats
Income Charts
Chart 1.6
Last updated 1/11/07
Download this chart in PDF
-
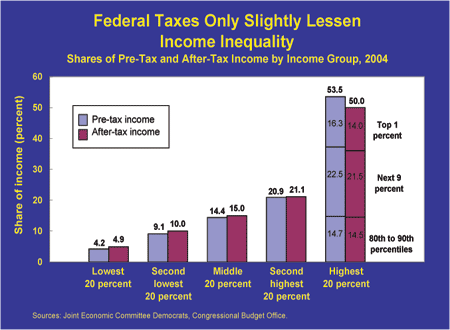
After-tax income is slightly less unequally distributed than pre-tax income due to the progressivity of the federal income tax, according to data from the Congressional Budget Office. When the income distribution is divided into fifths, the share of aggregate after-tax income is larger than the share of aggregate pre-tax income for each income group except the top 20 percent.
-
Although their share of after-tax income was lower than their share of pre-tax income, the 20 percent of households with the highest incomes still received half of aggregate after-tax income in 2004.
-
In 2004, the top 10 percent of households received more after-tax income than the bottom 60 percent of households combined36 percent for the top 10 percent of households, compared with 30 percent for the bottom 60 percent.
Source: Joint Economic Committee Democrats, based on Congressional Budget Office, Historical Effective Tax Rates: 1979 to 2004, December 2006, Table 1C. Click here for more information about the sources of income data.
|