|
Joint Economic Committee Democrats
Pension Charts
Chart 1.1
Last updated 7/21/06
Download this chart in PDF
-
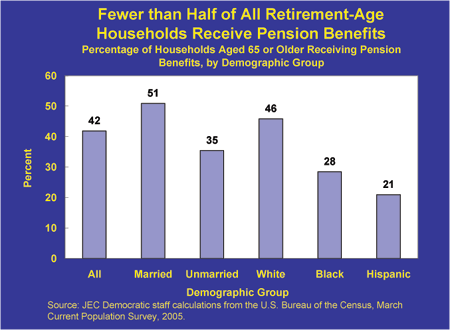
Overall, only 42 percent of households with a member aged 65 or older received pension benefits in 2004.
-
The receipt of pension benefits varies by demographic group. While 51 percent of married couples received benefits, only 35 percent of unmarried retirement-aged individuals did.
-
Minority retirees are less likely than whites to have a pension. About 28 percent of black and only 21 percent of Hispanic retirees received pension benefits, compared with 46 percent of whites.
Note: Households aged 65 or older include unmarried individuals and married couples in which at least one spouse is 65 or older. Pensions include private pensions and annuities, government employee pensions, regular payments from an IRA, Keogh, or 401(k) plan, and Railroad Retirement benefits.
|