E-PICs is a regular feature of the JEC Democrats' webpage.
New charts, each highlighting economic data of interest with important policy implications, will be released periodically.
Browse the archives
|
April 5, 2005
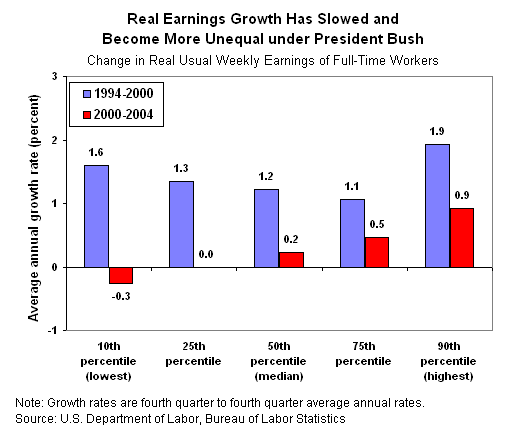
Distribution of Earnings Growth

Download this chart.
From the end of 1994 to the end of 2000, full-time workers saw their usual weekly earnings grow substantially faster than inflation, and those gains in real (inflation-adjusted) wages were evident for both higher-wage and lower-wage workers. From the end of 2000 to the end of 2004, in contrast, real weekly earnings in the lower half of the distribution have stagnated or even declined while those in the upper half have continued to grow. For example, real earnings at the middle of the distribution (the median, or 50th percentile), rose 1.2 percent per year from 1994 to 2000 but only 0.2 percent per year from 2000 to 2004. Real earnings at the 10th percentile, which grew 1.6 percent per year from 1994 to 2000, fell 0.3 percent per year from 2000 to 2004.
|
|

