E-PICs is a regular feature of the JEC Democrats' webpage.
New charts, each highlighting economic data of interest with important policy implications, will be released periodically.
Browse the archives
|
December 22, 2005
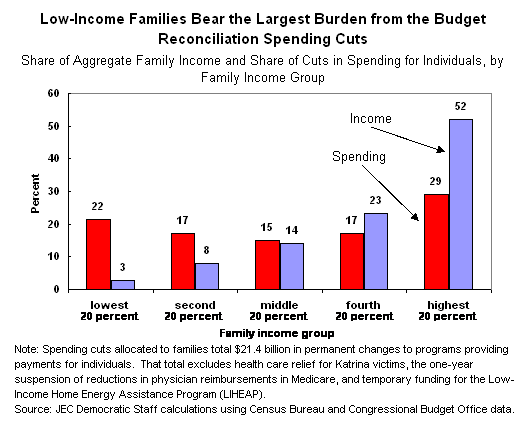
Distribution of Program Cuts and Income

Download this chart.
In the budget spending reconciliation bill enacted in December 2005, families in the poorest fifth of the income distribution bear a disproportionate burden from permanent cuts in programs providing payments for individuals. Those families have just 3 percent of aggregate family income, but they bear 22 percent of the net cuts in programs such as student loans, Medicare, and Medicaid. The bill reduces the FY 2006-2010 deficit by $39.7 billion (and includes savings that are not readily allocable to families, such as the proceeds from spectrum auctions). However, the FY 2006 budget resolution also provides for $70 billion of reconciled tax cuts, so that the net impact of reconciliation would be to increase the budget deficit. Based on action taken in the House and Senate so far, the bulk of the benefits from a tax reconciliation bill would go to people in the richest fifth of the income distribution.
|
|

