Inactive, Disconnected, and Ailing: A Portrait of Prime-Age Men Out of the Labor Force
Executive Summary
The share of prime-age men—between the ages of 25 and 54—that is neither working nor looking for work has been rising for decades. This rise has left an increasing number of men outside the world of work, historically an important source of social capital. Research suggests that these men often have especially constricted associational lives.
This report is intended to enrich our understanding of who these prime-age "inactive" men are. It summarizes evidence from past research and fills out our picture of these men, providing some details about their past and present social and emotional lives. We introduce an under-utilized dataset little-known to economists and sociologists, the "National Epidemiological Survey on Alcohol and Related Conditions-III," or NESARC-III.
Consistent with other survey data, the NESARC-III indicates that in 2013, 11 percent of prime-age men were outside the labor force. Roughly 45 percent of them indicate that their current situation involves illness or disability. Roughly 15 percent of inactive men are in school, 5 to 10 percent are retired, and another 5 to 10 percent are homemakers or caregivers. About a quarter of prime-age inactive men do not fit any of these categories. Contrary to the common view that most of these men have "dropped out" of the labor force after becoming discouraged by the job market, few prime-age inactive men indicate this to be true, and only 12 percent of able-bodied prime-age inactive men indicate in household surveys that they want a job or are open to taking one.
We confirm research by other scholars that a large number of inactive men are unambiguously and seriously sick or disabled. We provide new information, showing that many inactive men have poor physical health, poor mental health, or both. Over one-third of them (and nearly three in five disabled inactive men) are in the bottom quarter, nationally, of both physical and mental health.
Inactive men have fewer skills than employed men and live in poorer homes, often relying on public safety nets to get by. Two-thirds of inactive men personally received government assistance in the preceding year.
One-third of inactive men have been incarcerated (including nearly half of disabled inactive men). Along with other evidence presented here on mobility-impeding behavior, such high incarceration rates suggest employment challenges.
Though inactive men are relatively unlikely to have children, when they do, they are more likely than employed fathers to have children outside the home. Yet they are less likely to pay child support to the mothers of those children, possibly reflecting the disincentive to work that child support obligations create.
Finally, compared with employed men, inactive men are more socially isolated, less happy, and have more adverse childhood experiences to overcome. Productive social capital can provide opportunities to adults integrated into the world of work, but deficient social capital can limit the opportunities of children who will grow into inactive adults.
Introduction
August of 1953 was a lifetime ago. That month saw the Soviet Union announce that it had successfully tested its first hydrogen bomb. The United States returned nearly 400 ships to West Germany that it had seized during World War II. With the economy booming, 97.9 percent of American men between the ages of 25 and 54 were working or seeking work.
Much has changed over the decades, including the employment situation of men. In April of 2014, instead of 2.1 percent of prime-age men being "out of the labor force," as in the heady days of 1953, 12.1 percent were neither working nor seeking work. Despite recent increases in participation, that number remains elevated today, at 11.0 percent. The increase over the past few decades has been greater than in nearly all of our peer countries.1 What happened?
Answering this question is complicated and fully doing so requires data going back decades. The contours of this debate are reflected in three recent papers relying on the Bureau of Labor Statistics’ Current Population Survey (CPS).2 In the absence of other rich datasets going decades back in time, a number of researchers have instead relied on recent surveys to paint a contemporary portrait of these "inactive" men.
This report is intended to enrich our understanding of who prime-age inactive men are. As discussed in the Social Capital Project’s initial report, "What We Do Together," the typical inactive man appears to have an especially constricted associational life.3 Alan Krueger reports that inactive men "spend nearly 30 percent of their time alone, compared with 18 percent for prime age, employed men."4 A substantial portion of the waking hours of inactive men is taken up by television, video games, and electronic devices.5 What Nicholas Eberstadt has called "the death of work" has produced negative consequences at the personal and social levels that may be difficult to quantify but are easy to describe. These include the corrosive effects of prolonged idleness on personality and behavior, the loss of self-esteem and the respect of others that may attend a man’s voluntary loss of economic independence, and the loss of meaning and fulfillment that work demonstrably brings…6
Indeed, Krueger finds that inactive men have lower levels of subjective well-being than employed men—less satisfaction with their lives, less happiness, and more stress and sadness.
This report provides new information on inactive men, including some details about their past and present social and emotional lives. We introduce an under-utilized dataset little-known to economists and sociologists, the "National Epidemiological Survey on Alcohol and Related Conditions-III," or NESARC-III. Though intended primarily to examine "alcohol use and disorders and related physical and mental disabilities," because the survey asks respondents about their employment status, it provides information on inactive men that is otherwise unavailable.
Future work should focus on prime-age women who are out of the labor force and the ways in which they differ from their male counterparts. Women’s labor force participation has fallen since the 1990s, but the decline has been small relative to the massive rise that preceded it for more than half a century. In August of 1953, 37 percent of prime-age women were in the labor force. The rate peaked in April 2000 at 78 percent, and it was 75 percent in July of this year.
Introducing the NESARC-III
The NESARC-III is a nationally representative survey of the civilian noninstitutionalized population ages 18 and older.7 It was sponsored by the National Institute on Alcohol Abuse and Alcoholism at the National Institutes of Health. The survey was fielded in 2012 and 2013, interviewing 36,309 adults (and 8,932 men between the ages of 25 and 54). Importantly, the NESARC-III includes questions to ascertain mental disorders according to the Diagnostic and Statistical manual of Mental Disorders (DSM-5) as well as the Alcohol Use Disorder and Associated Disabilities Interview Schedule (AUDADIS-5).8 Access to the NESARC-III is restricted, and would-be users must sign a data use agreement to protect the privacy of participants.9 The survey collected saliva samples, and genetic data are available with tight restrictions. (We did not attempt to obtain genetic data.)
In our analyses, the sample generally consists of 7,020 employed and 1,162 inactive men between the ages of 25 and 54. The latter includes 532 disabled men, 212 students, 87 retirees, 52 homemakers, and 279 other inactive men. The estimates for homemakers and retirees are relatively imprecise.
Why are Inactive Men Out of the Labor Force?
The NESARC-III asks respondents to choose one or more of fourteen options to describe their economic situation. We grouped prime-age men—that is, between the ages of 25 and 54—into mutually exclusive and exhaustive categories: employed, unemployed, or one of five classes of inactivity (disabled, students, retirees, homemakers, and "other").10
In the 2013 Annual Social and Economic Supplement (ASEC) to the CPS, 82 percent of prime-age men were employed, 6 percent were unemployed, and 12 percent were out of the labor force. As shown in Figure 1, in our NESARC-III analyses, the estimates were 81, 7, and 11 percent—reassuringly close.
The categories of inactive men we created largely correspond with ones used in the CPS, either today or in the past. In the 2013 ASEC, 45 percent of prime-age men out of the labor force said they had a disability that limited or prevented work. We found that 44 percent of prime-age men out of the labor force said they were permanently disabled in the NESARC-III. The 2013 ASEC indicates that 6 percent of prime-age men who are out of the labor force were retired and did not have a disability that limited or prevented work. We found that 7 percent in the NESARC-III are retired and not permanently disabled.
Figure 1. Distribution of Prime-Age Men by Labor Force Status and Reason for Inactivity, CPS vs. NESARC-III
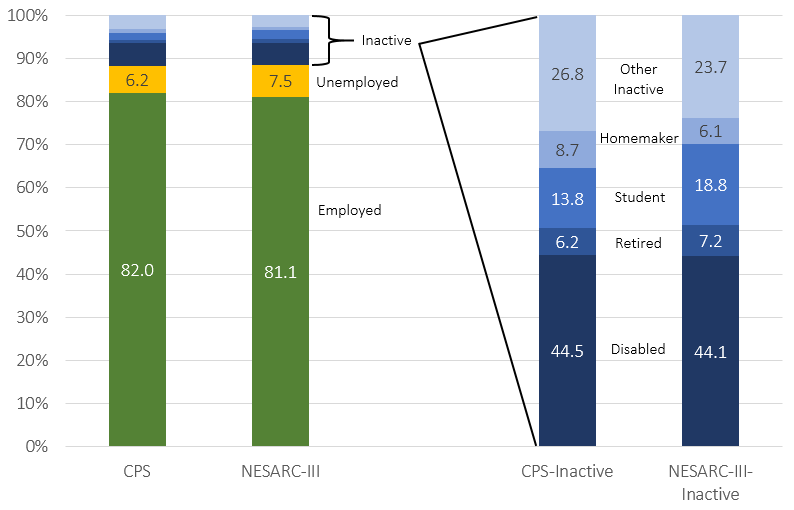
Source: Social Capital Project analysis of the NESARC-III microdata. Note: "Students" in the CPS include men on summer vacation, while they are excluded from the NESARC-III definition.
In the 2013 ASEC, 14 percent of prime-age inactive men not disabled or retired were enrolled in school, on holiday, or on vacation during the school year (but not on summer vacation). We found a higher share of such men in the NESARC-III who were in school (16 percent) and an even higher share (19 percent) who were either in school or on summer break or holiday and thus met our definition of a student. The 2013 ASEC indicates that 9 percent of prime-age inactive men were "taking care of house or family" and were not disabled, retired, or enrolled in school. Our corresponding figure was 6 percent. Finally, 27 percent of inactive men in the 2013 ASEC were outside all of these categories, compared with 24 percent in the NESARC-III.11
Inability to Find Work Is a Small Part of the Story
As a different way of classifying inactive men, we might ask how many are out of the labor force because they could not find work and stopped trying. There are several ways of getting at this question, all of them suggesting that relatively few prime-age inactive men fit this description. Winship (2017a) reported that only two to three percent of prime-age inactive men meet the Bureau of Labor Statistics’ definition of "discouraged workers" who have given up finding a job out of frustration. Winship also found that in 1993 (the last year in which all inactive men in the CPS were asked whether or not they wanted a job), 70 percent said they did not. In contrast, just 23 percent said they did want a job, and another 2 percent said they might. (The remainder didn’t know.) In 2014, about the same share of non-disabled men said they wanted a job (or might). Able-bodied men who wanted a job or were open to it constituted just 12 percent of all prime-age inactive men.
Looking at the data another way, Winship found that among prime-age men who had not worked the entire previous year, just 7 percent in 2014 said that the "main reason" they did not work was that they could not find a job. That compared with 52 percent who were disabled, 15 percent in school, 10 percent taking care of home or family, and 9 percent who were retired. Eberstadt (2016) also found that few prime-age men who are not working say they cannot find a job. Just 14 percent of those in the 2004 Survey of Income and Program Participation (SIPP) who hadn’t worked the previous 4 months said they could not find work—and that group included men who were in the labor force but unemployed (actively seeking a job).
Austin, Glaeser, and Summers (2018) report that between 1995 and 2015, the share of prime-age men who were inactive but did not want a job rose, while the share who were inactive and wanted a job was flat. Juhn, Murphy, and Topel (2002) indicate that very little of the rise in nonwork (including unemployment) from 1967 to 2000 was accounted for by men who could not find a job. Over half the increase was accounted for by disabled men. Similarly, Winship (2017a) found that from 1968 to 2014, men who could not find a job accounted for just 9 percent of the rise in inactivity throughout the entire preceding year. Men with a disability or illness accounted for 47 percent of the rise. He also estimated that men who wanted a job accounted for only 27 percent of the increase in inactivity from 1969 to 2014.
Demographics of Prime-Age Inactive Men
In Figure 2, we present the first of several breakdowns of prime-age inactive men using the NESARC-III data. The three sets of bar charts in Figure 2 break these men into three categories based on their age. The first two bars within each set contrast prime-age inactive men with prime-age employed men. The five bars below them contrast our five categories of prime-age inactive men. The percentages for any group of men, summed across the three bar charts, equals 100 percent, though this will not generally be true throughout the report. Prime-age inactive men in the NESARC-III are older than employed men. That is mostly due to retirees (81 percent of whom are between the ages of 45 and 54) and disabled inactive men, but older men are also overrepresented among "other" inactive men. Students tend to be younger, unsurprisingly; seven in ten are ages 25 to 34.
Winship (2017a) shows that non-disabled, non-retired inactive men who do not want a job are younger than those who want a job. The CEA found that, holding age constant, labor force participation has fallen steadily across birth cohorts from 1943 to 1992 at nearly all age levels. Within-age changes in labor force participation account for nearly all the rise in inactivity, with changes in the age distribution of men accounting for practically none of the rise.
President Obama’s Council of Economic Advisers (2016) also reported that prime-age inactive men are more likely to live in the South than men generally. Winship (2017a) showed that prime-age inactive men are more likely to live in the Southeast specifically, and they are more likely to live in rural areas. Eberstadt (2016) reported that compared with employed men, inactive men are more likely to be black and less likely to be an immigrant.
Figure 2. Age of Prime-Age Employed and Inactive Men
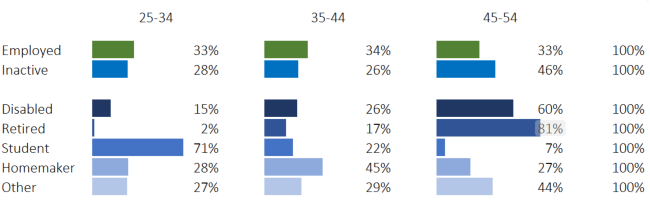
Source: Social Capital Project analysis of the NESARC-III microdata.
Attachment to the Labor Force
Most inactive men have little attachment to work. Eberstadt’s analyses indicate that 68 percent of prime-age inactive men had been inactive for at least a year in 2014—up from about half of such men in 1994. Accounting for inactive men who had been unemployed in the previous year, the Council of Economic Advisers found that 83 percent of inactive prime-age men had not worked in over a year as of 2015. That was an increase from 73 percent in 1988.
While at any point in time, men with low labor force attachment make up the bulk of inactive men, a large share of men spending any time inactive do so for relatively brief periods. Because they cycle into and then out of inactivity, while men with low labor force attachment remain inactive month after month, the importance of this "in-and-out" population (to use the term of Coglianese, 2018) is understated by point-in-time snapshots. According to Austin, Glaeser, and Summers (2018), of the prime-age men who switched jobs in at least one of eight months in which they were observed over a 16-month period, 67 percent were out of the labor force for at least one of those eight months.
Coglianese divides inactive men into in-and-outs and dropouts. The former were in the labor force during at least one of eight months when they were participating in the CPS (two four-month periods separated by 8 months). "Dropouts" were out of the labor force during all eight months. In-and-outs were 62 percent of the combined groups. Both groups became more prevalent over time, but two-thirds of the rise in prime-age male inactivity from 1977 to 2015 was accounted for by dropouts. The rise in in-and-outs has been primarily due to an increase in employment-to-nonparticipation flows, not to a decline in nonparticipation-to-employment flows, an increase in flows that involve unemployment, nor an increase in the duration of nonparticipation spells.
Figure 3 shows that while 90 percent of employed men worked in the previous twelve months and had no unemployment spell lasting a month, that was true of just 19 percent of inactive men. More typically, inactive men neither worked in the previous twelve months, nor had any month-long spell of unemployment (meaning that they were inactive the whole year). That was true of 58 percent of them. Another 23 percent had experienced an unemployment spell of a month or more in the previous year. That is to say, just one in four prime-age inactive men spent time looking for work in the preceding year.
Figure 3. Work Attachment of Prime-Age Employed and Inactive Men
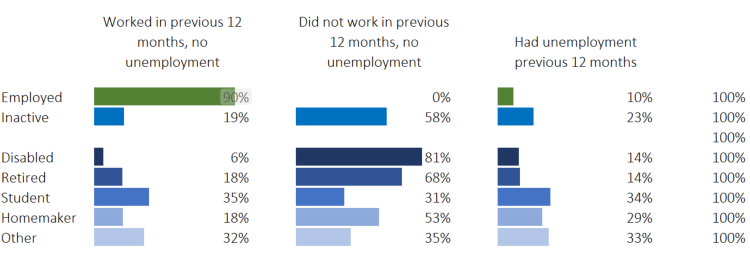
Source: Social Capital Project analysis of the NESARC-III microdata.
Striking patterns emerge in terms of the experiences of different types of inactive men. Four out of five disabled inactive men were inactive the entire previous twelve months, as were two-thirds of retirees and over half of homemakers. Students and those in the "other" category were roughly evenly divided between workers in the past year with no unemployment, full-year inactive men, and men with some unemployment in the past year. All five categories of men were more likely to have been inactive the whole year or unemployed part of the year, compared with employed men.
Schooling and Occupation
The top part of Figure 4 confirms the findings of Eberstadt (2016) and Winship (2017a) that inactive men have lower educational attainment than employed men or men generally. Notably, one in three disabled men does not have a high school education. In contrast, 42 percent of students already have a college degree. The bottom part of Figure 4 reveals that inactive men are more likely than employed men to have been in school the previous year. By definition, 100 percent of non-disabled, non-retired students were in school in the past year.
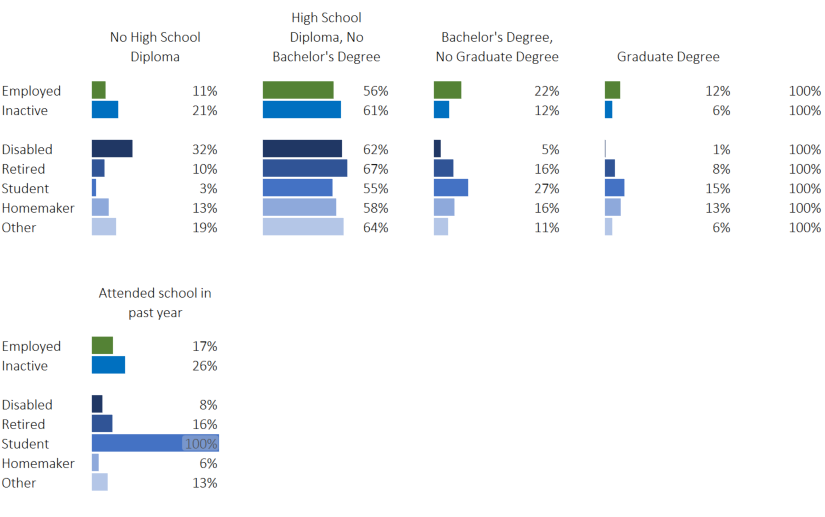
Source: Social Capital Project analysis of the NESARC-III microdata.
Interestingly, Tuzemen (2018) finds that inactivity rose most over the past 20 years among men with a high school diploma but no bachelor’s degree. Also worth noting is the finding from Juhn, Murphy, and Topel (2002) that the rise in nonwork (including unemployment) from 1967 to 2000 was greater among men with lower hourly wages. Coglianese (2018) finds that "in-and-outs" are better educated than other inactive men.
Turning to occupations, Figure 5 shows that inactive men are more likely than employed men to have worked in a blue-collar job as their last occupation.12 That was only true, however, of disabled and "other" inactive men. These results are consistent with Winship (2017a), which found that disabled men (and non-disabled men who wanted a job) included disproportionate shares of men who had last worked a "physical, blue-collar job."13
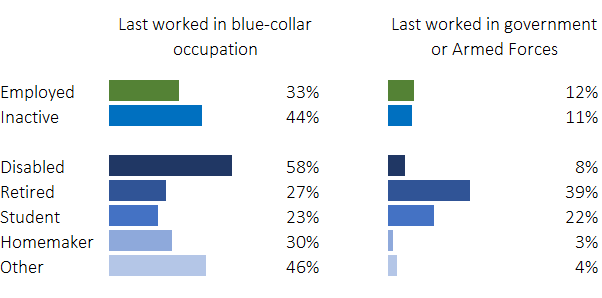
Source: Social Capital Project analysis of the NESARC-III microdata.
Another result shown in Figure 5 is that while inactive men as a whole are about as likely as employed men to have worked in government or the Armed Forces in their most recent position, students and, especially, retirees are disproportionately comprised of men previously holding those occupations. Retirees are over three times as likely as employed men to have come from the government or Armed Forces sectors, suggesting that generous public employee or military pensions facilitate early retirement.
Social Connectedness
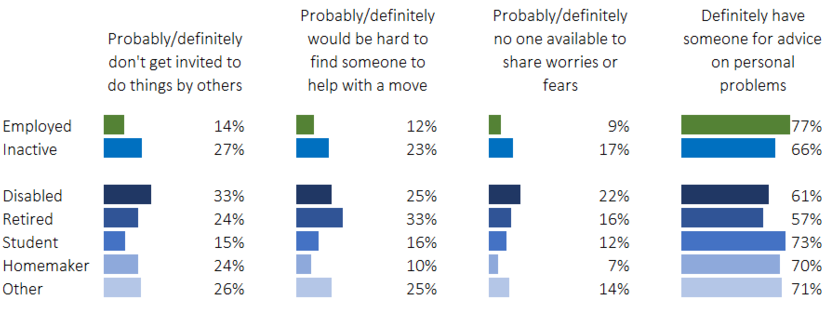
Figure 6 considers several measures of social connectedness, a topic that has generated less attention among previous researchers of labor force nonparticipation. Compared with employed men, prime-age inactive men are twice as likely to say that they don’t often get invited to do things with others, that it would be difficult to find someone to help them with a move, and that there is no one to share worries and fears with. They are less likely to say that they have someone they could turn to for personal problems. Students resemble employed men on these dimensions, and homemakers present a mixed picture, consistent with many of them living with family but having weaker ties to those who work outside the home.
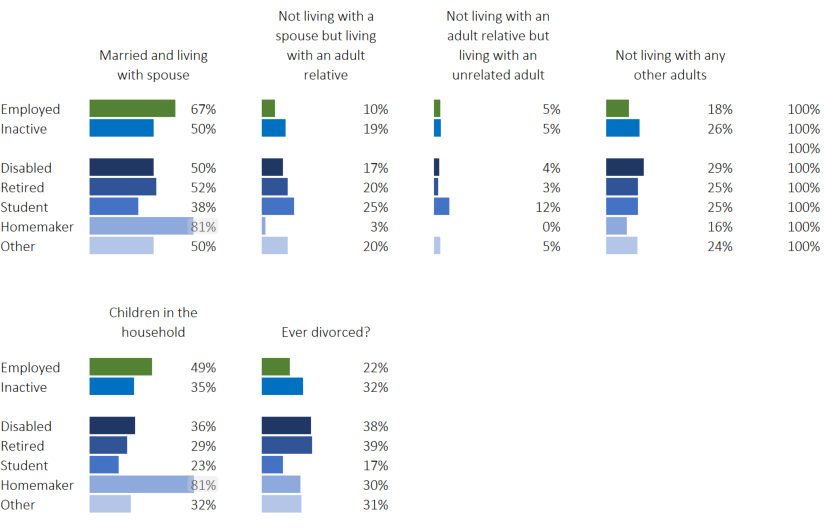
This disconnectedness suggests that workplace ties are not being replaced by relationships inactive men have outside of work. One reason for that is that inactive men are more likely to live alone. In the upper part of Figure 7, we show that over one in four inactive men are the only adult in their home, compared with 18 percent among employed men. Eberstadt (2016) reported that compared with employed men, inactive men are less likely to be married (or to have ever married). Consistent with that finding, Figure 7 shows that while two-thirds of employed men are married, only half of inactive men are (ranging from 38 percent among students to 81 percent among homemakers). Fully 20 to 25 percent of students, retirees, and "other" inactive men are single and live with an adult relative. That is consistent with the finding in Winship (2017a) that prime-age inactive men are much more likely than prime-age men generally to be single and living with a relative who heads the household. Figure 7 also shows that 12 percent of students live with a roommate (or cohabiting partner).
Source: Social Capital Project analysis of the NESARC-III microdata.
Source: Social Capital Project analysis of the NESARC-III microdata.
The lower part of Figure 7 confirms Eberstadt’s finding that inactive men are less likely to have children than employed men. Only homemakers are more likely than employed men to live with children; four in five do so. Inactive men are also somewhat more likely than employed men to have ever gotten divorced. Retirees and disabled inactive men are almost twice as likely as employed men to have done so.
The lower social connectedness found here adds nuance to Eberstadt’s time-use finding that compared with employed men, inactive men have effectively substituted "socializing, relaxing, and leisure" for work. It is true that many of these activities are not necessarily social (watching television, listening to the radio, arts and crafts, playing video games and other games). However, Krueger (2017) finds that among all men 16-35, over half the time spent playing games was with another person, and 70 percent of the time it involved interacting with someone else.14 Further, Eberstadt finds that inactive men spend two hours per week more on "socializing and communicating with others" than employed men. Apparently, this added time does not compensate for the weaker or narrower web of social connections they have.
Coglianese (2018) reports that "in-and-outs" are more likely than other inactive men to be married or cohabiting. He also finds that half of the rise in in-and-outs involves men who are married or cohabiting, and most of the rest involves men living with parents. The rise involving men who are married or cohabiting appears to be driven by higher earnings of partners. Winship (2017a) finds that about three in four prime-age inactive men are living with a spouse, cohabiting partner, or another family member who heads the household. The latter group alone describes a quarter of inactive men.
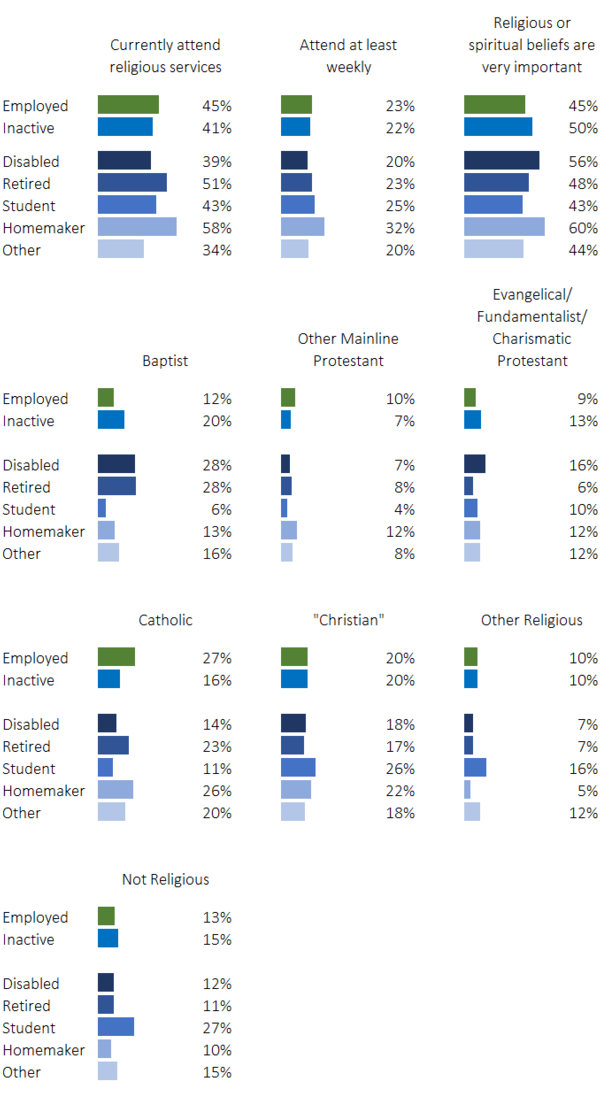
Finally, another form of social connection is through religious communities. The upper left panel of Figure 8 indicates that homemakers and retirees are more likely to attend religious services than employed men, though retirees are no more likely to attend weekly (upper middle panel). Inactive men are more likely to say that their religious beliefs are very important than are employed men, especially disabled men and homemakers. The bottom six panels divide prime-age men into six categories based on their self-reported religious affiliation.15 Baptists are over-represented among inactive men, and especially among disabled and retired men. Evangelical/fundamentalist/charismatic Protestants (those outside Mainline Protestantism) are also over-represented among inactive men, especially among the disabled. Meanwhile, Catholics are under-represented among inactive men, especially disabled men and students, and non-religious men are over-represented among students.
Source: Social Capital Project analysis of the NESARC-III microdata.
Childhood Experiences and Social Support
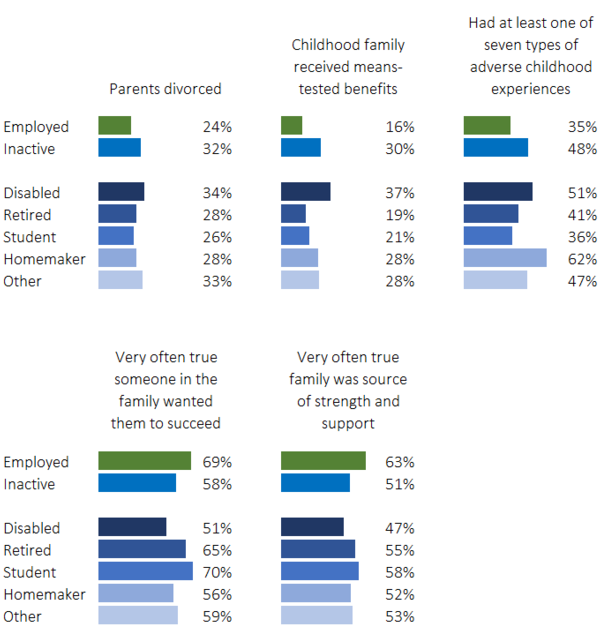
The NESARC-III includes questions about the childhood experiences of inactive men, another area related to social capital that labor force surveys typically ignore. We have already seen that inactive men are more likely to be divorced than employed men. They are also somewhat more likely to have experienced a parental divorce (Figure 9). Below, we will see that inactive men are more likely to receive federal means-tested benefits than employed men. In Figure 9, we show that they are about twice as likely as employed men to have been raised in a family that received such benefits during their childhood.
The NESARC-III also includes questions allowing for the computation of "adverse childhood experience" (or ACE) scores. Half of inactive men experienced at least one of seven ACEs during their childhood, compared with roughly one-third of employed men.16 Homemakers are most likely to have experienced an ACE, though the estimate is imprecise.17 Half of disabled men have experienced an ACE, and nearly half of "other" inactive men. Students are no more likely than the employed to have experienced an ACE.
The bottom panels of Figure 9 indicate that inactive men received somewhat less support from their families in childhood than employed men. Students stand out as an exception.
Source: Social Capital Project analysis of the NESARC-III microdata.
Physical Health
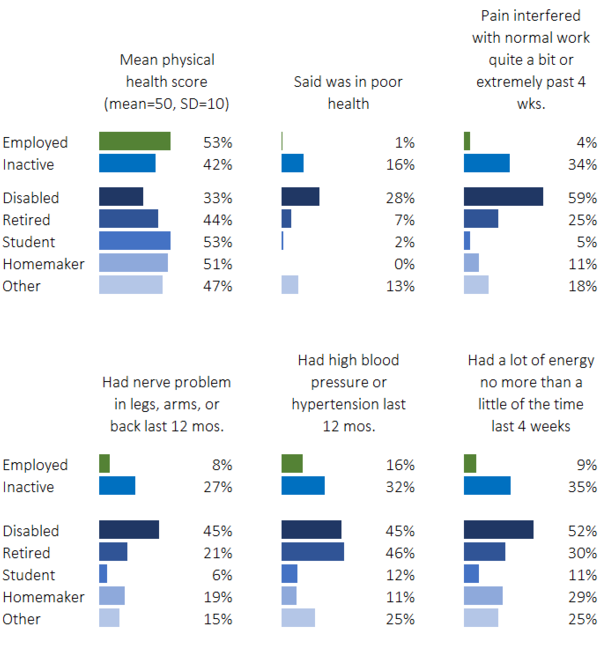
As noted above, nearly half of prime-age inactive men indicate they are permanently disabled. Unsurprisingly, disabled inactive men report poor physical and mental health. Figure 10 focuses on physical health. The NESARC-III includes nationally normed scores summarizing physical health (Physical Health Composite Scores, from the Short-Form 12 Health Survey, Version 2). The mean of these scores is 50, meaning that a score of less than 50 implies physical health that is below the national average.18 In the upper left corner of Figure 10, we can see that on average, inactive men have worse health than employed men (and men generally, since the mean is below 50). However, students and homemakers are as physically healthy as employed men. Retirees score lower, but in all likelihood, that just reflects the fact that they are older than the other groups. As one might expect, disabled men fare much worse than everyone else. Their mean score of 33 is at the 6th percentile of prime-age men in the NESARC-III.
Source: Social Capital Project analysis of the NESARC-III microdata.
These patterns recur for other indicators of physical health. Disabled inactive men are much more likely than other men to rate their own health as poor, to say that pain interfered with their normal work "quite a bit" or "extremely," and to indicate they have had a nerve problem. With retired men, they are more likely than other men to have had high blood pressure or hypertension in the past year. Students and homemakers generally fare as well as employed men on these measures. Notably, more than half (59 percent) of disabled men said that pain had interfered in their "normal work" "quite a bit" or "extremely" in the previous month. More than half also said that at most, they had a lot of energy "a little of the time" in the previous month.
These results support the findings of Krueger (2017), who reports that substantial numbers of inactive men are in pain and poor health. While just 12 percent of employed prime age men rate their health as fair or poor, 43 percent of inactive men do. (Our NESARC-III estimates are 9 percent and 43 percent.) In Krueger’s survey, only one in five employed men report having taken pain medication the previous day, but 44 percent of inactive men do, including 58 percent of inactive men with one of six disabilities. Krueger presents evidence from an online survey suggesting that about two-thirds of inactive men who took pain medication used prescription medication. The same survey found that 40 percent of prime age inactive men said that pain prevented them from working fulltime.
Krueger also reports that one-third of prime age inactive men report one of six disabilities in the CPS, including 40 percent of those with no more than a high school education, and 42 percent of men 40 to 54 years old. Disabled inactive men report more pain than disabled employed men.
Using other measures of wellbeing, Austin, Glaeser, and Summers (2018) also found that prime age men who are not working (including those who are looking for work) are significantly more likely to have physical health problems and physical activity limitations than the employed are.
There is some ambiguity in the data in trying to assess how many men who report themselves disabled or in pain could take a job. For one, the subjective severity of pain is difficult to assess on an individual basis. In addition, some inactive men who report a disability and who receive federal disability benefits may be taking advantage of the system. If they were concerned about the confidentiality of this federal survey, these men would want to give answers to the physical and mental health questions in the NESARC-III that are consistent with their being eligible for disability benefits.
Several data points suggest that disabled men have become less likely to work over time. Krueger found that inactivity rose from 2009 to 2017 among prime-age men with a disability. This serendipitously extended the same finding reported by Burkhauser and Daly (2011) for the 1982 to 2009 period, which demonstrates that the Krueger finding was not simply the result of starting with a Great Recession year. Krueger also found that while the share of inactive men reporting day-long pain sometime in previous three months did not change much from 1997 to 2015, employment conditional on having pain fell somewhat. It may be that these trends simply reflect that more men used to work through pain in the past, that subjective pain thresholds have diminished, or that health care providers have become more likely to diagnose physical and mental problems. But none of these hypothetical changes are likely to explain declines in inactivity in the past decade.
Bolstering the case that some men reporting themselves disabled do not have work-impeding pain is the recurrent finding—currently being reinforced in the ongoing economic expansion—that disability rolls decline when the economy improves and increase when it takes a dip. Along the same lines, countries with more generous welfare states have higher rates of self-reported disability, even controlling for demographics and health.19 Between 1982 and 2006, states with higher GDP had lower disability rates, whether comparing states to themselves in different years or comparing different states in the same year.20
Other research suggests that it has become easier to receive federal disability benefits over time, and that that has induced more prime-age men to leave the labor force.21 To be sure, a sizable share of prime-age inactive men has always been disabled. In 1968, prior to the creation of SSI or the rise in SSDI rolls, the vast majority were.22 That most disabled inactive men are likely to be deserving of federal benefits is not inconsistent with the existence of a non-negligible share that could be working.
Mental Health
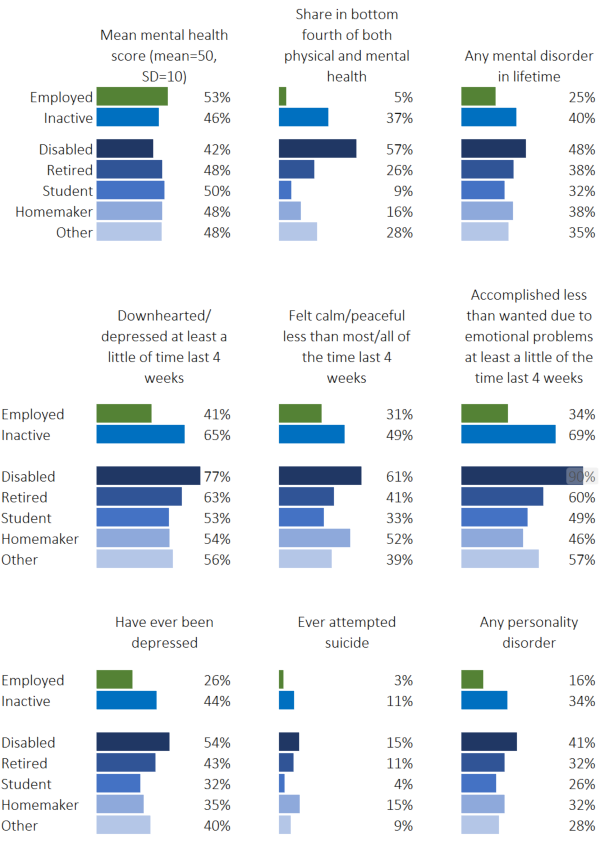
In Figure 11, we display nine mental health indicators, highlighting the challenges that inactive men—often socially disconnected—face. Inactive men fare worse than employed men on all nine of them. Once again, disabled men have the worst health across most of these measures. More than half of them are in the bottom quarter nationally of both physical and mental health (based on their Physical Health Composite Score and Mental Health Composite Score). A shocking 90 percent of disabled men said they had accomplished less than they wanted in the last month due to emotional problems. Nearly half had suffered a mental disorder at some point in their lives.23 Half indicated they had been depressed in the past for at least two weeks.24 Disabled men fared worst on every indicator, though homemakers were just as likely to have attempted suicide.
Source: Social Capital Project analysis of the NESARC-III microdata.
As noted in the introduction, Krueger (2017) found that inactive men spend nearly twice as much time alone compared with employed men. He also reports that inactive men have less satisfaction with their lives, less happiness, and more stress and sadness than employed men. Similarly, Austin et al. indicate that inactive men have low life satisfaction and poor mental health at rates that are more than double those of the employed.
It is unclear the extent to which poor mental health is caused by poor physical health, but this is surely part of the story among the disabled. Also unclear is the extent to which poor mental health is caused by social disconnection. In our analyses, we found that average mental health scores among inactive men were correlated with the extent to which they felt they had no one with whom to share their worries and fears. Men who said that sentiment was "definitely false" were near the national average (mean score of 48). The mean declined to 44 among those saying the statement was "probably false," to 41 among those saying it was "probably true," and to 39 among those saying it was "definitely true." Inactive men with higher ACE scores also had lower mental health scores on average, suggesting that family experiences in childhood may matter for adult wellbeing.
Criminal Activity and Other Mobility-Impeding Behavior
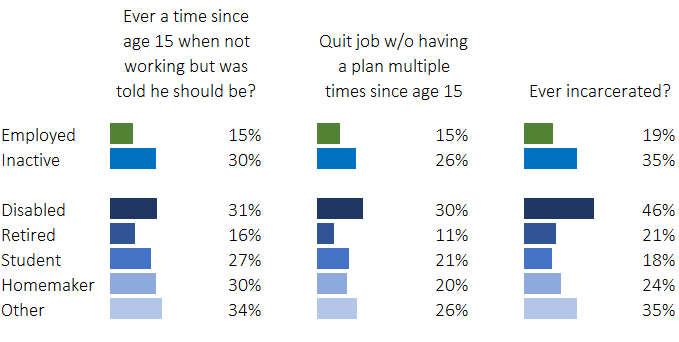
The NESARC-III includes a wide range of questions that assess "conduct disorder" and "antisocial personality disorder." These questions allow an examination of behaviors that impede upward mobility. For instance, the left panel of Figure 12 reveals that twice as many inactive men as employed men have had a time since age 15 when they were not working and other people thought they should have been. Retirees were no more likely than employed men to say that was the case. The patterns are very similar in terms of how many prime-age men have quit their job more than once without having another one lined up.
Inactive men are also much more likely to have ever been incarcerated than employed men. Over one-third of inactive men have been incarcerated, including nearly half of disabled men and over a third of "other" inactive men. Since a criminal record impedes the ability to find a job, it is possible that many ex-convicts have withdrawn from the labor force out of frustration. However, it could just be that many men who commit crimes are more likely to have characteristics that make them undesirable hires.
Eberstadt (2016) presents evidence suggesting that inactive men are more likely to have a criminal record, and Winship (2017a), using a survey sponsored by the Kaiser Family Foundation, CBS News, and the New York Times, reported that one-third of prime-age inactive men were ex-convicts. Eberstadt also finds that inactive men are more likely than employed men to admit to illegal drug use. Our analyses found that by the DSM-5 definition of drug or alcohol use disorder, inactive men who were disabled, students, or who fell into the "other" category were more likely to have an issue with substance abuse than employed men, though the differences were modest.
Source: Social Capital Project analysis of the NESARC-III microdata.
Multi-Partner Fertility and Child Support Obligations
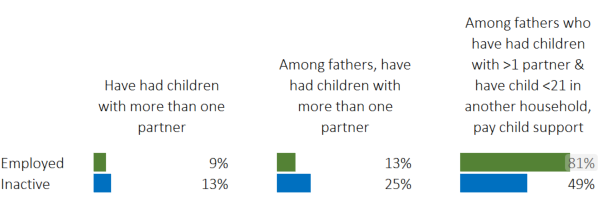
Child support obligations are another barrier to employment for some men. If they can find other ways to support themselves, those options may be more attractive than working and having part of each paycheck go to another household. The NESARC-III does not include information on this topic, so we turned to another survey, Wave One of the 2014 Survey of Income and Program Participation (SIPP). Figure 13 shows estimates for employed men and inactive men as a whole. (The samples sizes were unreliably small when we tried to analyze the groups of inactive men.) Inactive men are somewhat more likely than employed men to have children born to multiple mothers. However, that is despite the fact that inactive men are less likely to have any children. One in four inactive fathers has children with multiple mothers—twice the rate for employed fathers. Yet, if we focus on fathers with children by multiple mothers who have at least one child under 21 living outside the household, employed fathers are much more likely than inactive ones to pay child support. Four in five employed fathers in this situation pay child support, compared with just half of inactive fathers.25 While hardly proof that prime-age inactivity results in part from the threat of wage garnishment to pay child support obligations, the evidence here is consistent with that possibility.
Source: Social Capital Project analysis of the 2014 Wave 1 Survey of Income and Program Participation microdata.
Income and Receipt of Government Transfers
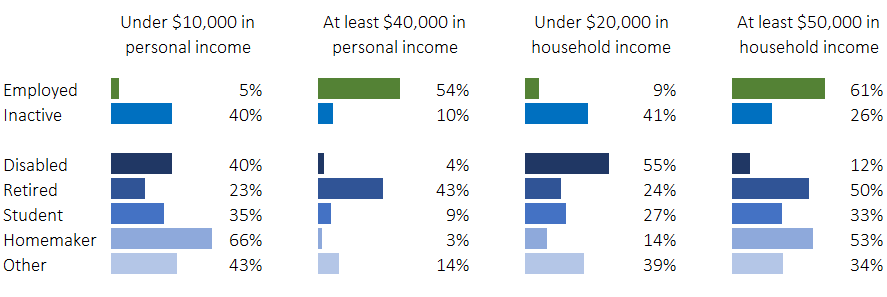
In Figure 14, we look at the share of prime-age men with low or high personal income or household income over the preceding 12 months. Unsurprisingly, given that inactive men do not work and, in many circumstances, have not worked for some time, they have much lower personal income than employed men. That is especially true of homemakers, and it is less true of retirees. Inactive men also have much lower household income than employed men. This time, disabled men do worst, while sizable shares of retirees and homemakers have relatively high household incomes.
Source: Social Capital Project analysis of the NESARC-III microdata.
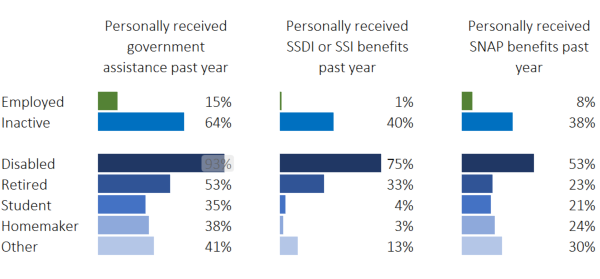
One source of personal income received by inactive men is government transfers. The left panel of Figure 15 shows that nearly two-thirds of inactive men received benefits in the preceding year from either Social Security, Supplemental Security Income (SSI), Temporary Assistance for Needy Families (TANF), Emergency Assistance, Women, Infants, and Children Program (WIC), Supplemental Nutrition Assistance Program (SNAP), Medicare, Medicaid, or military health care programs. That includes 93 percent of disabled men who are inactive and over half of retirees. Four in ten prime-age inactive men received disability payments in the form of Social Security Disability Insurance (SSDI) or SSI. Among those who are disabled, three in four received benefits from one of these programs. However, a third of retirees did as well, suggesting that the pool of disabled inactive men may be larger than our "disabled" group suggests. Given the poor health that disabled men report, it is unsurprising that so many also indicate receiving disability benefits. However, nearly as many prime-age inactive men received SNAP benefits as got disability benefits, and the disabled were most likely to rely on them (with over half receiving benefits).
Source: Social Capital Project analysis of the NESARC-III microdata.
Eberstadt (2016) and Winship (2017a) both found similar results. Eberstadt showed that among prime-age inactive men who were household heads, 63 percent received means-tested benefits in 2013. He found that 57 percent of prime-age inactive men received disability benefits, and 66 percent lived in a household where someone was getting disability. Winship found that three in four prime-age inactive men lived in a household with transfer income, including 90 percent of disabled men.
Consistent with the other Coglianese (2018) results reported above, in-and-outs appear to be in better socioeconomic circumstances than other inactive men. They have higher incomes and are much less likely to have transfer income. Their food expenditures also decline less upon exiting the labor force than is the case for unemployed job losers or retirees. They are more likely to be homemakers or in school and less likely to be disabled or retired.
Conclusion
This report has summarized the evidence on the characteristics of prime-age inactive men and enriched our picture of them by bringing new data to bear. The decline in prime-age male labor force participation has left an increasing number of men outside the world of work, historically a source of identity, pride, independence, and social connectedness (to say nothing of money). As noted in the Social Capital Project’s flagship report, "What We Do Together," coworkers constitute an important aspect of our social lives, "[w]hether in the carpool lane, offsite at lunch, in the break room, at the holiday party, behind the counter during down times, out on business trips, or post-work at the bar or on the softball field."26 The rise in inactivity, then, contributes to the withering of American associational life.
Determining what should be done to arrest and reverse the rise in inactivity depends on further improving our understanding of the motives, aspirations, objectives, and capabilities of these men. If many inactive men would work were the wages on offer better, that might imply policies to promote tighter labor markets or to subsidize low-wage work. If many would work but for the increasing accessibility of disability benefits as a safety net, that might imply reforms to SSDI, SSI, and veteran’s disability programs. If few inactive men want a job, that implies a different set of policies than if most would prefer to work. If many men are simply too sick or disabled to work, that should inform our goals for increasing labor force participation.
The pool of inactive prime-age men is irreducibly diverse. We have confirmed research by other scholars that a large number of them are unambiguously and seriously sick or disabled. They have poor physical health, poor mental health, or both. Nevertheless, because health, medical, and workforce changes should have reduced the ranks of this group over time, and because policy changes have increased the number of men claiming disability, it is very likely that a non-negligible share of men who declare themselves disabled in household surveys could work without difficulty.27 At the same time, many inactive men are in school, retired, or primarily responsible for taking care of family and the home. It is unclear that there is any role for public policy in nudging them into the workforce. Finally, about a fifth to a quarter of prime-age inactive men do not appear to fall into any of these categories. We should better understand these men, though that may require bigger datasets with new survey questions.
The evidence presented in this report suggests that inactive men have fewer skills than employed men and live in poorer homes, often relying on public safety nets to get by. Many of them have been incarcerated, which, along with other evidence on mobility-impeding behavior, suggests employment challenges. Though inactive men are relatively unlikely to have children, when they do, they are more likely to have children outside the home. Yet they are less likely to pay child support to the mothers of those children, possibly suggesting reforms to child support policy both to encourage work and to ensure paternal obligations are fulfilled.
Compared with employed men, inactive men are more socially isolated, less happy, and have more adverse childhood experiences to overcome. Whether through greater work, where appropriate, or by other means of connecting them to community, we ought to consider how we might expand inactive men’s access to social capital. Finally, as policymakers seek to expand opportunities for these men to work and otherwise contribute to society, they may need to address the damage done to many inactive men by unhealthy family lives growing up. Productive social capital can provide opportunities to adults integrated into the world of work, but deficient social capital can limit the opportunities of children who will grow into inactive adults.
Bibliography
Aaronson, Stephanie, Tomaz Cajner, Bruce Fallick, Felix Galbis-Reig, Christopher Smith, and William Wascher (2014). "Labor Force Participation: Recent Developments and Future Prospects." Brookings Papers on Economic Activity (Fall). https://www.brookings.edu/bpea-articles/labor-force-participation-
recent-developments-and-future-prospects/.
Abrahamson, Katherine and Melissa Kearney (2018). "Explaining the Decline in the U.S. Employment-to-Population Ratio: A Review of the Evidence." NBER Working Paper, No. 24333. National Bureau of Economic Research. http://www.nber.org/papers/w24333.
Austin, Benjamin, Edward Glaeser, and Lawrence Summers (2018). "Saving the American Heartland: Place-Based Policies in 21st Century America." Brookings Papers on Economic Activity (Spring). https://www.brookings.edu/bpea-articles/saving-the-heartland-place-
based-policies-in-21st-century-america/.
Autor, David and Melanie Wasserman (2013). "Wayward Sons: The Emerging Gender Gap in Labor Markets and Education." Third Way. https://www.thirdway.org/report/wayward-sons-the-
emerging-gender-gap-in-labor-markets-and-education.
Burkhauser, Richard V. and Mary C. Daly (2011). The Declining Work and Welfare of People with Disabilities (Washington, DC: American Enterprise Institute).
Coglianese, John (2018). "The Rise of In-and-Outs: Declining Labor Force Participation of Prime Age Men." Job market paper. https://scholar.harvard.edu/files/coglianese/files/coglianese_
2017_in-and-outs.pdf.
Council of Economic Advisers (2016). "The Long-term Decline in Prime-Age Male Labor Force Participation." https://obamawhitehouse.archives.gov/sites/default/files/page/files/
20160620_cea_primeage_male_lfp.pdf.
Eberstadt, Nicholas (2016). Men without work: America’s invisible crisis. (West Conshohocken, PA: Templeton Press).
Juhn, Chinhui and Simon Potter (2006). "Changes in Labor Force Participation in the United States." Journal of Economic Perspectives 20(3): 27-46. https://www.aeaweb.org/articles?id=10.1257/
jep.20.3.27.
Juhn, Chinhui, Kevin Murphy, and Robert Topel (2002). "Current Unemployment, Historically Contemplated." Brookings Papers on Economic Activity 33(1): 79-136. https://www.brookings.edu/bpea-articles/current-unemployment-historically-contemplated/.
Krueger, Alan B. (2017). "Where Have All the Workers Gone? An Inquiry Into the Decline of the U.S. Labor Force Participation Rate." Brooking Papers on Economic Activity (Fall). https://www.brookings.edu/bpea-articles/where-have-all-
the-workers-gone-an-inquiry-into-the-decline-of-the-u-s-labor-force-participation-rate/.
Moffitt, Robert (2012). "The Reversal of the Employment-Population Ratio in the 2000s: Facts and Explanations." Brookings Papers on Economic Activity (Fall). https://www.brookings.edu/bpea-articles/the-reversal-of-the-
employment-population-ratio-in-the-2000s-facts-and-explanations/.
O’Brien, Rourke L. (2015). "Disability and the Worlds of Welfare Capitalism." Sociological Science 2: 1-19.
_____ (2013). "Economy and Disability Labor Market Conditions and the Disability of Working-Age Individuals." Social Problems 60(3): 321-333.
Tuzemen, Didem (2018). "Why Are Prime-Age Men Vanishing from the Labor Force?" Federal Reserve Bank of Kansas City Economic Review. https://www.kansascityfed.org/publications/research/er/articles/2018/
1q18tuzemen-why-prime-age-men-vanishing.
U.S. Congress, Joint Economic Committee, Social Capital Project (2017). "What We Do Together: The State of Associational Life in America." Report prepared by the Vice Chairman’s staff, 115th Cong., 1st Sess. (May 2017). https://www.lee.senate.gov/public/_cache/files/b5f224ce-98f7-40f6-a814
-8602696714d8/what-we-do-together.pdf.
Winship, Scott (2017a). "What’s behind Declining Male Labor Force Participation: Fewer Good Jobs or Fewer Men Seeking Them?" Mercatus Research. Mercatus Center at George Mason University.
https://www.mercatus.org/publications/declining-male-labor-force-participation-jobs.
_____ (2017b). "Declining Prime-Age Male Labor Force Participation: Why Demand- and Health-Based Explanations Are Inadequate." Mercatus Working Paper. Mercatus Center at George Mason University.
https://www.mercatus.org/publications/declining-male-labor-force-participation.
_____ (2015). "How to Fix Disability Insurance." National Affairs 36 (Spring).
https://www.nationalaffairs.com/publications/detail/how-to-fix-disability-insurance.
Endnotes
1 Eberstadt (2016).
2 See Council of Economic Advisers (2016), Winship (2017a), Winship (2017b). See also Juhn, Murphy, and Topel (2002) and Juhn and Potter (2006). Autor and Wasserman (2013) focus on the drop in the employment-to-population ratio (which is affected by trends in the unemployment rate) from 1979 to 2008. Moffitt (2012) also focuses on the drop in the employment-to-population ratio, but only from 1989 to 2007. Abrahamson and Kearney (2018), too, examine the employment-to-population ratio, but only from 1999 to 2016, and Aaronson et al. (2014) look at it from 2007 to 2014. Austin, Glaeser, and Summers (2018) conduct limited analyses from 1980 to 2010, also based on the employment-to-population ratio.
3 U.S. Congress, Joint Economic Committee, Social Capital Project (2017).
4 Krueger (2017).
5 The Council of Economic Advisers (2016) present results suggesting around half of waking hours are spent watching television—twice as much time as prime-age men generally. Eberstadt (2016) finds that, on average, prime-age inactive men spend five and a half hours a day watching television or movies. The estimates for working men and unemployed men were roughly two hours and three and a half hours, respectively.
6 Eberstadt (2016), 152.
7 See https://www.niaaa.nih.gov/research/nesarc-iii.
8 The NESARC-III was preceded by the 1988 Alcohol Supplement of the National Household Interview Survey, the 1991-1992 National Longitudinal Alcohol Epidemiological Survey, the Wave 1 NESARC (2001-2002), and the Wave 2 NESARC (2004-2005).
9 See https://www.niaaa.nih.gov/research/nesarc-iii/nesarc-iii-data-access
/procedures-obtaining-dataset. This manuscript was prepared using a limited access dataset obtained from the National Institute on Alcohol Abuse and Alcoholism and does not reflect the opinions or views of NIAAA or the U.S. Government.
10 We characterized prime-age men as employed if they said that they were working either full time or part time, were employed but not at work due to a temporary illness or injury, employed but on vacation, or employed but absent from work without pay. A small number of these men also indicated they were unemployed or out of the labor force, but we included them as employed. We classified men as unemployed if they were not “employed” and indicated that they were “unemployed or laid off and looking for work.” Finally, all other men who were not “employed” or “unemployed” were classified at out of the labor force.
We further grouped prime-age men out of the labor force according to their “present situation.” Men who indicated they were “unemployed and permanently disabled,” were deemed disabled. (Note that in most analyses of joblessness, “unemployed” means that someone is not working, but available for work and looking for work. The NESARC-III survey seems to have used “unemployed” to mean, simply, “not working.”) Men who were not “disabled” and who said they were in school full or part time or “on summer break/holiday from school” were classified as students. Those men indicating they were retired were categorized as such if they were not disabled and were not students. Men declaring themselves “full time homemakers” were classified as such if they were not in one of the prior categories. Finally, the remaining men out of the labor force (present situation of “unemployed or laid off and not looking for work” or “some other activity”) were designated “other.”
11 To estimate the number of students and homemakers in the CPS, we incorporated information from the Basic Monthly Survey variable indicating the major activity of those not in the labor force who did not give “disabled” or “retired” as a reason for their inactivity. This variable is called NILFACT in the IPUMS data. To use this variable, we merged the ASEC to the Basic Monthly Survey.
12 These occupations include jobs in farming, forestry, and fishing; precision production, craft and repair; operators, fabricators and laborers; transportation and material moving; and handlers, equipment cleaners and laborers.
13 These occupations include jobs in farming, fishing, and forestry; construction and extraction; installation, maintenance, and repair; building and grounds maintenance; production; and transportation and material moving.
14 Krueger (2017) also reports that among inactive men 21-30, time spent “playing games” rose 86 percent from 2004-2007 to 2012-2015, but it was largely matched by a decline in television watching.
15 Survey respondents were shown a card with 56 options from which to choose. We grouped these responses into the six categories in Figure 8. “Other Mainline Protestant” includes Lutherans, Methodists, Episcopalians, Presbyterians, several other denominations with Calvinist roots (Christian Reform, United Church of Christ, Disciples of Christ, Dutch Reformed), two Anabaptist denominations (Church of the Brethren and Mennonites), and Quakers. About 80 percent of prime-age men in this category are Lutheran, Methodist, or Presbyterian.
“Evangelical/Fundamentalist/Charismatic Protestants” include Adventists (Seventh-Day Adventists and Church of God), Pentacostal denominations (Apostolic, Assemblies of God, Foursquare Gospel, Full Gospel, and Pentacostalism), Holiness Movement denominations (Church of the Nazarene, “Holiness/Holy,” and the Salvation Army), Churches of Christ, Independent Christian Church, Spiritualists, “Protestant,” “Fundamentalist,” and “Evangelical/Born Again.” About 50 percent of these prime-age men answered “Pentacostal,” “Protestant,” “Church of God,” or “Churches of Christ.” The distinction between mainline and other Protestants is rough, since many mainline denominations have evangelical offshoots, and many people answering “Protestant” are part of a mainline denomination. Further, many people answering “Christian” are Protestant but not categorized as mainline or not mainline.
“Other Religious” includes Mormons, Jews, Muslims, Eastern Orthodox, Buddhists, Hindus, Sikhs, Taoists, “Unitarian/Universalist,” Christian Science, Jehovah’s Witness, Scientologist, “Native American,” New Age, Druid, Pagan, Wiccan, Rastafarian, Santeria, Eckankar, Ethical Culture, Baha’i, and “Other Religion.” About 60 percent in this group are Buddhist, Muslim, Jewish, Hindu, or Mormon.
“Not religious” includes “No religious affiliation,” agnostics, and atheists.
16 We followed the scoring methodology from the original ACE study by Felitti, et al. (https://www.ajpmonline.org/article/S0749-3797(98)00017-8/fulltext). The seven types of ACEs include experiencing psychological abuse, physical abuse, sexual assault or abuse, substance abuse, mental health problems, violence against one’s mother, or incarceration. The specific experiences incorporated into the ACE scores for this report include an adult living in the home (1) swearing, insulting, or saying hurtful things to the respondent fairly often or very often; (2) doing something to make the respondent fearful of being physically hurt (fairly often or very often); (3) pushing, grabbing, slapping, or hitting the respondent fairly or very often; (4) hitting the respondent so hard that it left a mark or bruise or injured them (fairly or very often); (5) having a drinking problem; (6) having a drug abuse problem; (7) being treated for a mental illness; (8) attempting suicide; and (9) being incarcerated. They also include an adult male living in the home (10) pushing, grabbing, slapping, or throwing something at an adult female in the home (sometimes, fairly often, or very often); (11) kicking, biting, or hitting an adult female in the home (at least sometimes); (12) hitting an adult woman in the home repeatedly for at least a minute (at least sometimes); and (13) threatening or using a knife or gun against an adult woman in the home (sometimes, fairly often, or very often). Further, they include (14) ever being touched sexually when not wanted (or when too young to understand what was happening); (15) being made to touch someone else sexually when the respondent didn’t want to (or when he was too young to understand); and (16) experiencing a rape or (17) attempted rape. All of these experiences relate to the time before a respondent turned 18.
17 There are only 52 prime-age inactive male homemakers in the data.
18 The standard deviation is 10 in the US population. Physical health scores range from just under 5 to just over 71 among prime-age men in the NESARC-III.
19 O’Brien (2015).
20 O’Brien (2013).
21 Winship (2015).
22 Winship (2017a).
23 As assessed by the NESARC-III, including having experienced a major depressive episode, a major depressive disorder, dysthymia, a manic episode, a hypomanic episode, a bipolar 1 episode, a specific phobia, social phobia, panic disorder, agoraphobia, generalized anxiety disorder, posttraumatic stress disorder, anorexia nervosa, bulimia nervosa, and binge-eating disorder. These are defined by the Diagnostic and Statistical Manual of Mental Disorders (DSM-5).
Personality disorders in Figure 11 are defined by the DSM-5. Personality disorders include schizotypal personality disorder, borderline personality disorder, conduct disorder, and antisocial personality disorder.
24 We identify men as depressed if they said that (1) over a two-week period: they had “felt sad, hopeless, depressed, or down nearly every day,” “other people noticed that you were sad, hopeless, depressed, or down nearly every day,” they didn’t care about things that they usually cared about, or other people noticed that they didn’t care about things they usually cared about, or (2) over a two-year period, their mood was low more than half the time.
25 Of course, men may be paying child support to someone outside the household but not have had children by multiple mothers. However, we were concerned about the interpretation of the estimates if we considered all fathers with someone under 21 outside the household. As best we can tell, adult children who have moved out of the home of their married parents are counted as “someone under 21 outside the household.” If the fathers of these children make up a larger share of fathers with “someone under 21 outside the household” among the employed than among the inactive, then interpreting the share of fathers who pay child support is not straightforward. We checked the result in Figure 13 in a second way that reassured us. We confined the sample to fathers with someone under 21 outside the household who reported having ever had more children than their wife or cohabiting partner (regardless of whether they reported multipartner fertility). Within this group, 81 percent of employed fathers reported paying child support, versus just 52 percent of inactive men—almost exactly the same as when we focus on men with multipartner fertility. This comparison is also not ideal in that some men with a child outside the household may be living with a woman with two or more biological children ever born to her.
26 U.S. Congress, Joint Economic Committee, Social Capital Project (2017), 42.
27 Winship (2015, 2017b).