Skip to main content
United States Congress Joint Economic Committee
About
Hearings
Annual Reports
Republicans
Democrats
Search
Newsroom
Members
2026 Joint Economic Report
Data and research
Employment Update
Debt Dashboard
Fiscal Update
Inflation Update
GDP Update
Expenditures Update
Trade Update
Medicare Affordability Tracker
Health Care Resources
Health Care Resources
Month
January
February
March
April
May
June
July
August
September
October
November
December
Year
2021
2020
2019
2018
2017
2016
Issues
Budget
Connecting More People to Work
Economy
Health
Improving the Effectiveness of Investments in Youth and Young Adults
Improving Youth Investment
Increasing Family Stability
Increasing How Many Children are Raised by Happily Married Parents
International
Labor
Making It More Affordable to Raise a Family
Monetary Policy
Rebuilding Civil Society
Regulation
Social Capital Project
Tax
Feb 19
,
2021
The Epidemic Preceding the Pandemic: Will Utah's Progress Hold?
Read the report
>
Feb 1
,
2021
The Epidemic Preceding the Pandemic: Opioid Overdoses Surge Again
Read the report
>
Jul 30
,
2018
U.S. Economy Makes a Comeback—4.1% Growth in Q2
Read the report
>
Jul 26
,
2018
Fact Check: Yes, Data Show Workers’ Earnings Have Improved
Read the report
>
Jul 26
,
2018
Chairman Paulsen talks trade, tax reform 2.0, and medical device tax repeal on Bloomberg Politics
Read the report
>
Nov 3
,
2017
End of Days to Follow End of Cost Sharing Reduction Subsidies?
Read the report
>
Oct 2
,
2017
Weekly Economic Update: October 2 – October 6, 2017
Read the report
>
Sep 26
,
2017
Four Takeaways from CBO’s Health Insurance Subsidy Report
Read the report
>
Aug 16
,
2017
Chair Tiberi Launches New Podcast
Read the report
>
Jul 14
,
2017
How Obamacare Tax Hikes Hurt Low- and Middle-Income Americans
Read the report
>
« First
< Previous
Page 1 of 3
1
2
3
Next >
Last »
Most Popular
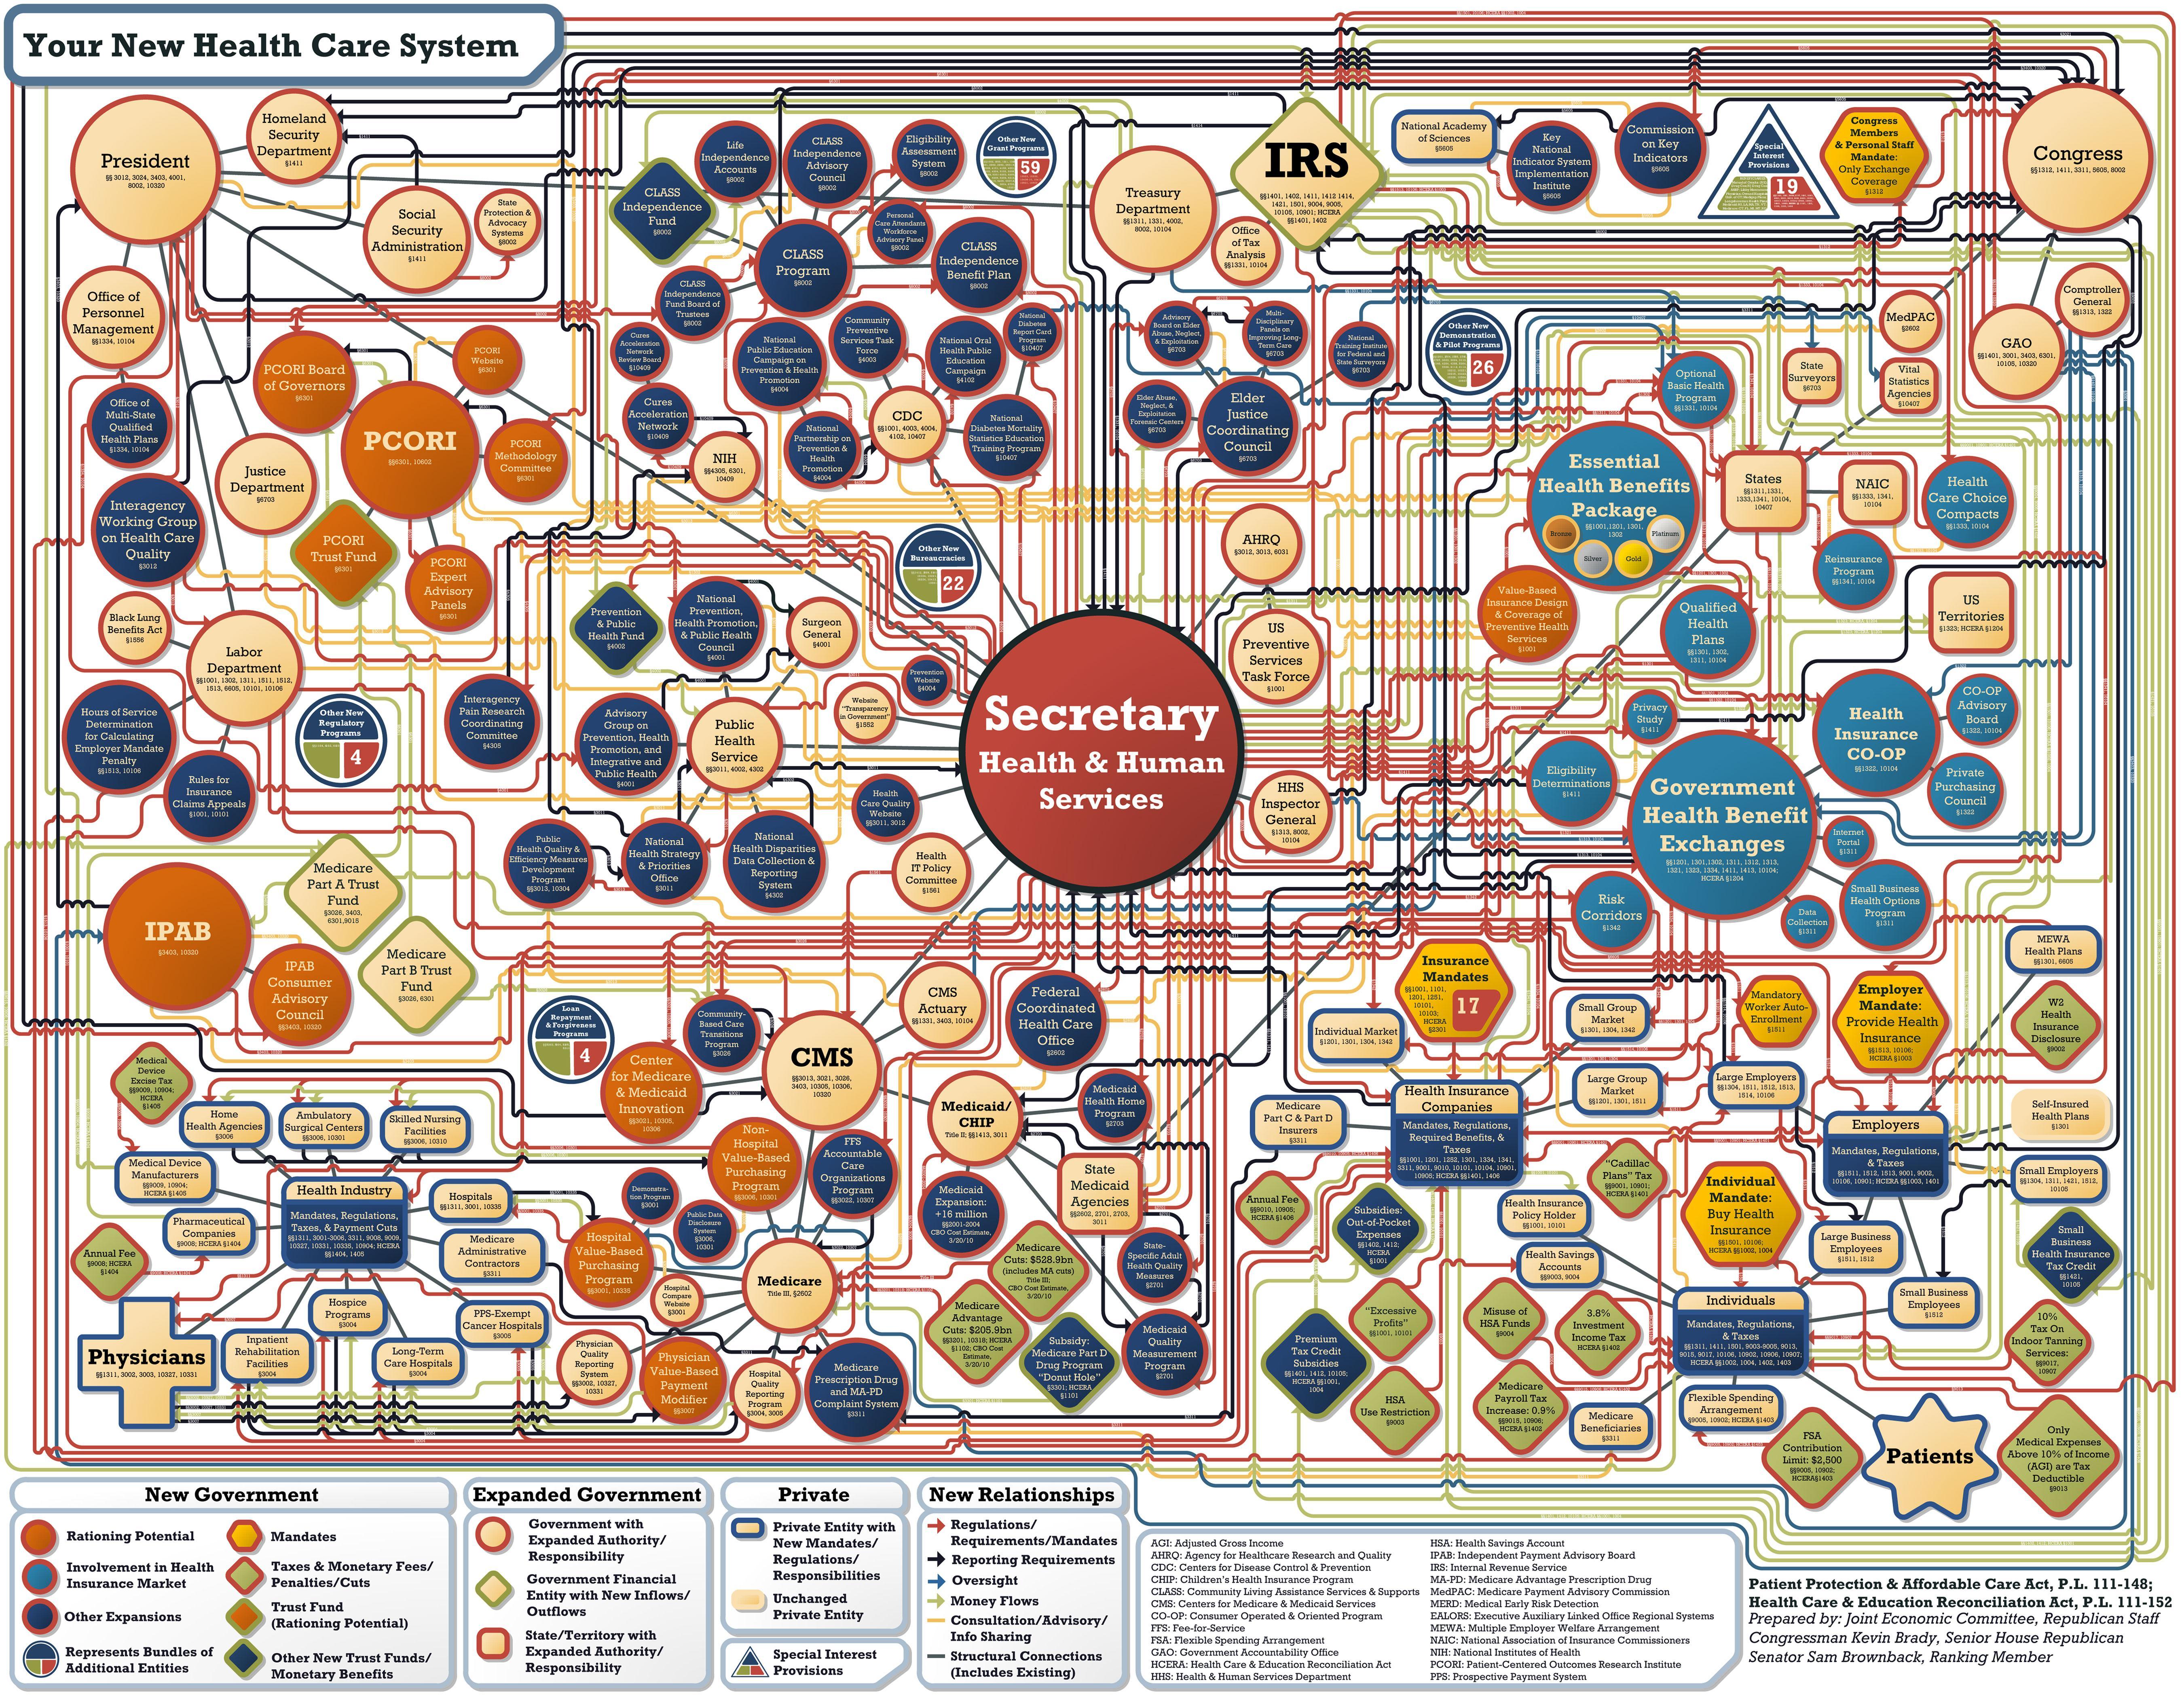
How Obamacare Was Envisioned to Work
Obamacare Premium Increases
Another Obamacare Enrollment Air Ball